Report Card Map Help
Welcome to the Healthy Waterways Report Card Map. This interactive tool displays the ecosystem health grades for the waterways in South East Queensland.
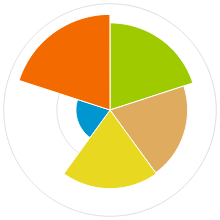
What do the colours mean?
The colours on the map represent each reporting component
- Orange: freshwater
- Green lines: estuaries
- Blue: bay areas
The shading for each colour reflects the grade received – the lighter the colour shade, the better the grade.
Navigation
There are a number of ways to navigate around the map:
Map search: Hover your mouse over the map to see the grades for each reporting zone. Use your mouse to zoom-in and drag around the map. Click on a zone for further detail which will appear on the right of your screen.
Postcode search: Enter a postcode in the top blue bar and select the reporting zone from the drop down box
Select catchment: Select a reporting zone from the drop down list in the top blue bar
Search by component: Use the Freshwater, Estuarine and Marine tabs at the top right of your screen to view all grades for each component that year.
Search by year: Use the slider in the bottom right of your screen to switch between reporting years. Results from 2000-2008 will be loaded soon.
Reporting zone detail
When a reporting zone is selected, further information about the zone will appear on the right of your screen. Use the tabs at the top of the content area (under the name of the zone) to switch between overview information and detail about the grade/s.
To exit this view – click the ‘X’ in the triangle tab.
Reset
Reset your selections on the map using the orange ‘X Reset’ tab on the left side of the screen
Case studies
Explore projects being undertaken throughout the region using the ‘Case Studies’ tab on the left side of the screen.
Back to website
Navigate back to the main Healthy Waterways website by clicking the Healthy Waterways logo in the top left corner of the screen.
- A = Excellent: Conditions meet all ecosystem health values; all key processes are functional and all critical habitats are in near pristine condition.
- B = Good: Conditions meet all ecosystem health values in most of the reporting region; most key processes are functional and most critical habitats are intact.
- C = Fair: Conditions meet some ecosystem health values in most of the reporting region; some key processes are functional and some critical habitats are impacted.
- D = Poor: Conditions are unlikely to meet ecosystem health values in most of the reporting region; many key processes are not functional and many critical habitats are impacted.
- F = Fail: Conditions do not meet ecosystem health values; most key processes are not functional and most critical habitats are severely impacted.
- NA = No data available for this reporting year
Score range: 0.0 = poor/fail to 1.0 = excellent
Note: The bigger the segment, the better the result.